ANOVA with R
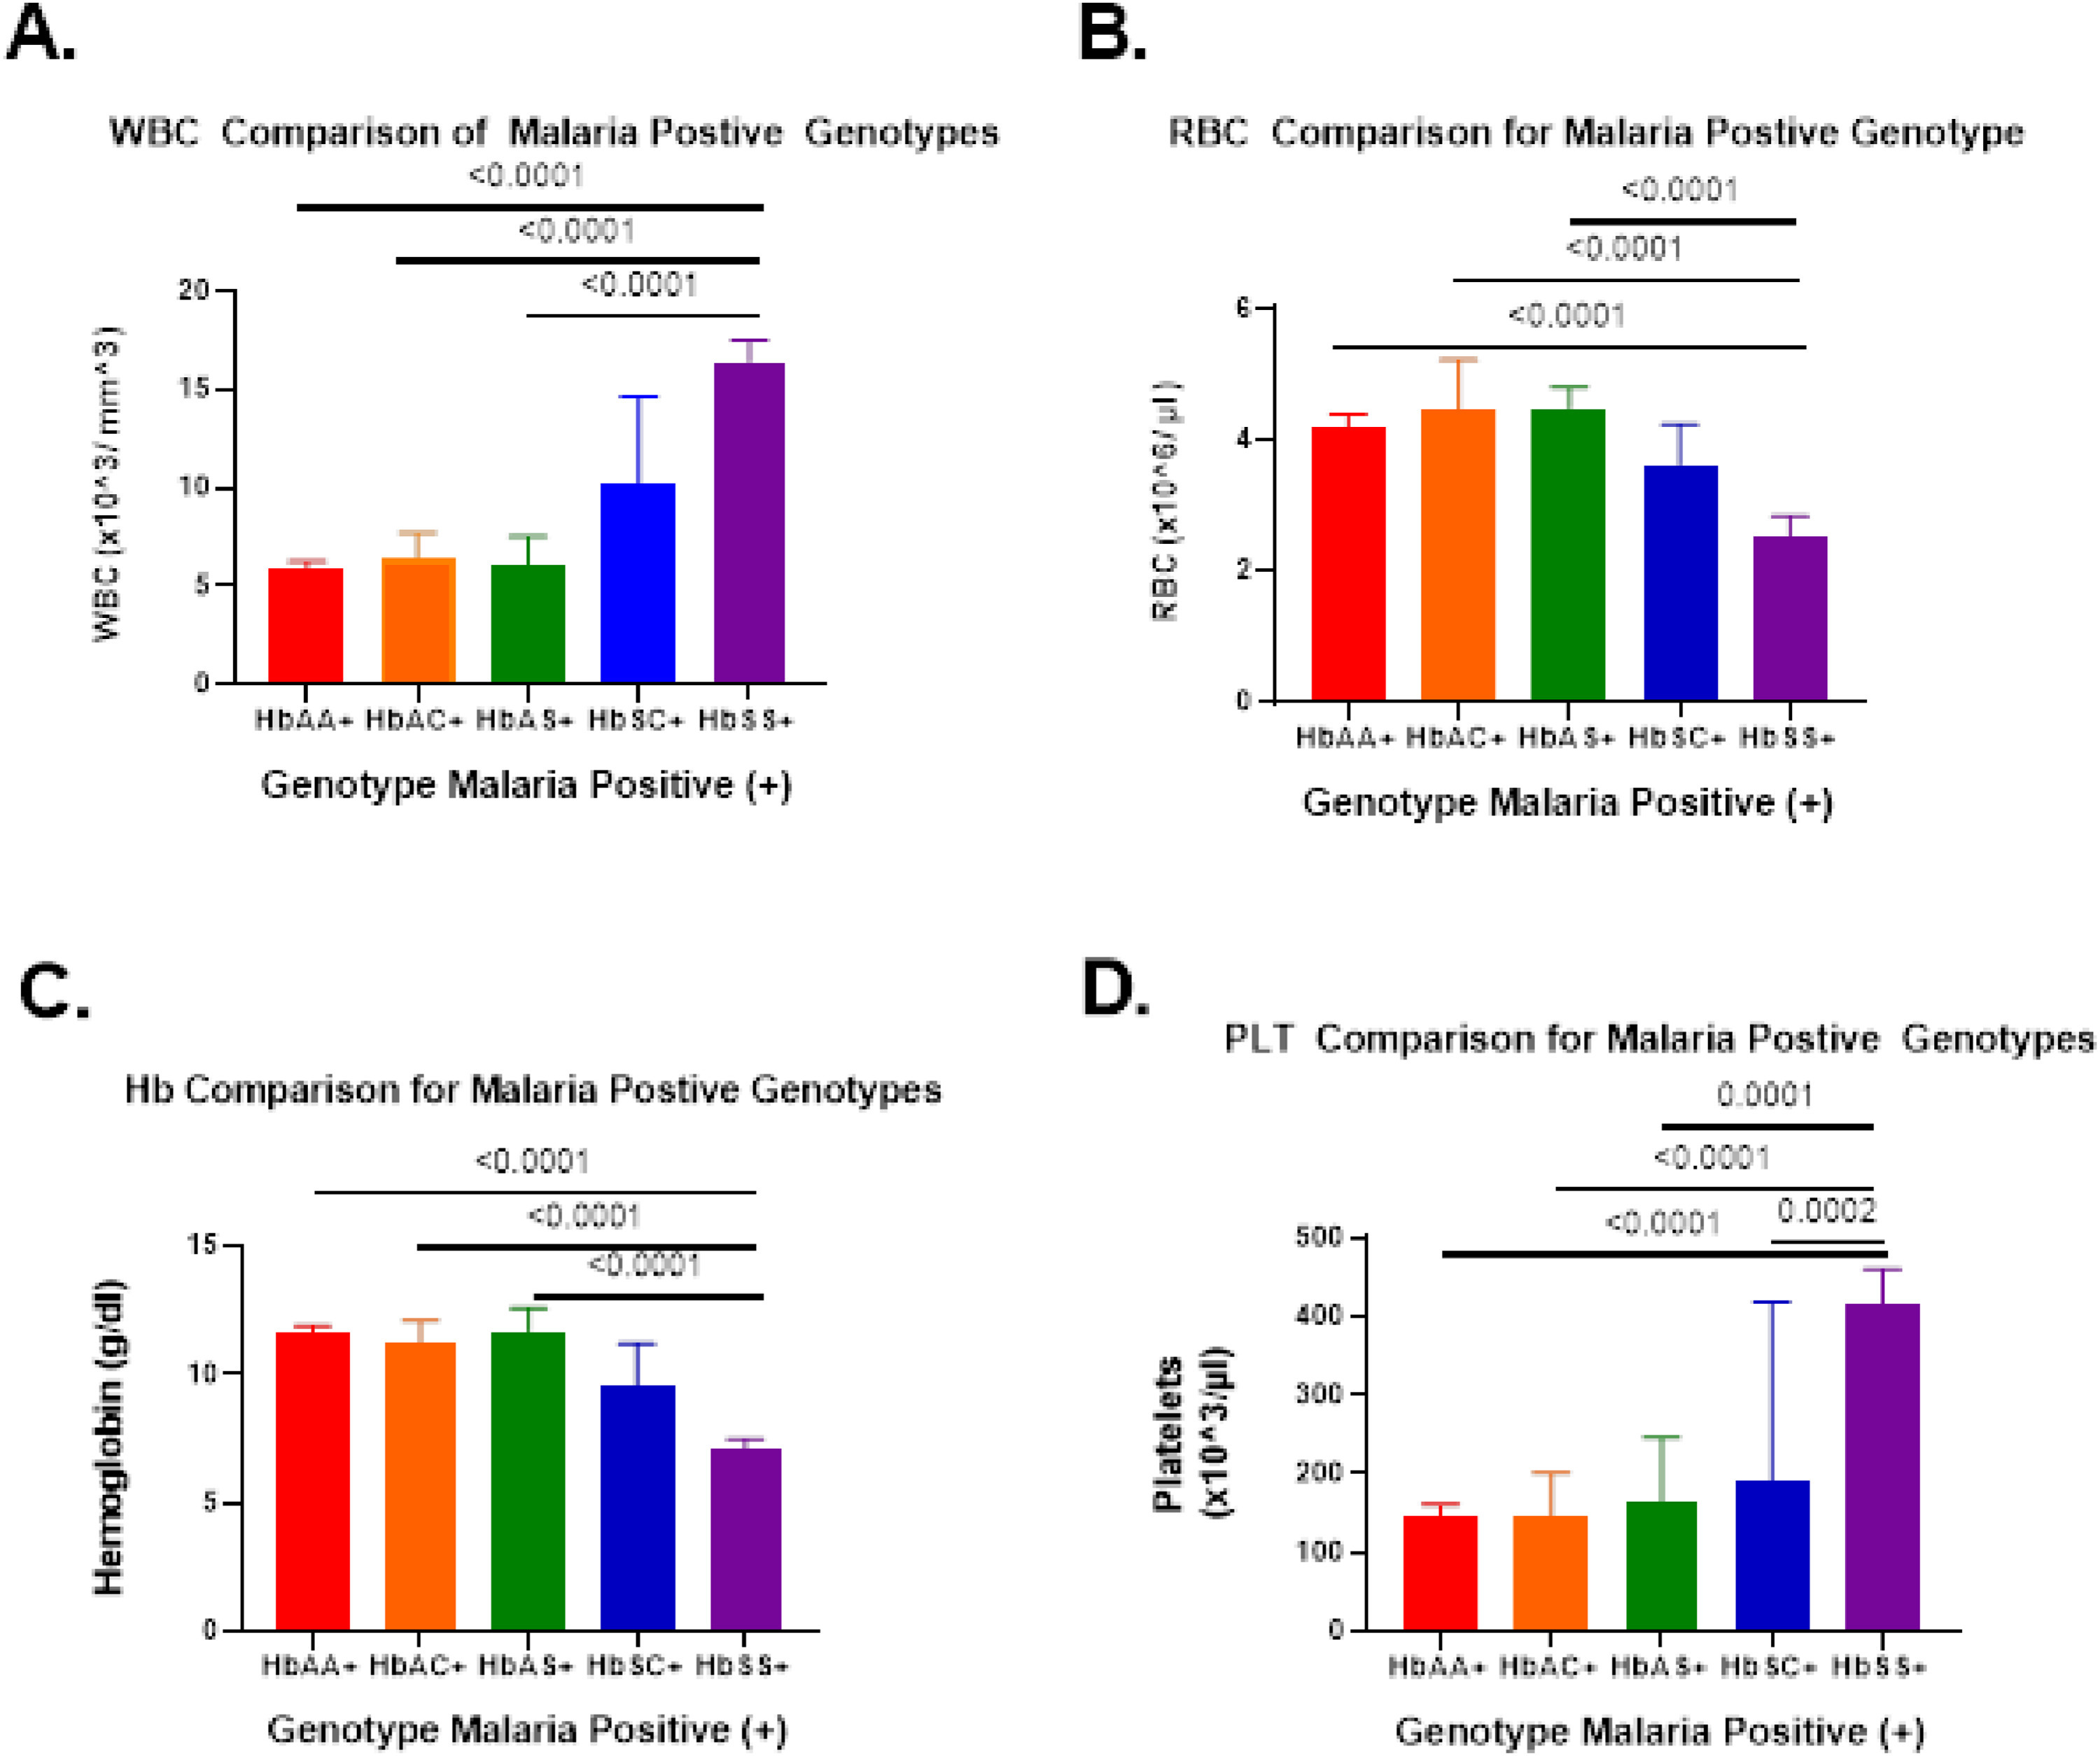
Picture source: Fig.2 from Harp et al, eClinical Medicine Volume 39, September 2021, 101045 DOI: https://doi.org/10.1016/j.eclinm.2021.101045.
The aim of this short course is to explain why we have to analyse variances if we want to compare group means using ANOVA techniques. This lecture is best taken with the Linear regression with R course. Please note that we cannot go into the specific data analysis problems of your particular project.
Instructor: András Aszódi.
Topics
- The intuition behind ANOVA: Comparing the means of several samples by analyzing variances.
- Technical details: One-way ANOVA techniques: prerequisites, omnibus F-test, post hoc tests.
- Getting the sample size right: Power and sample size calculations.
- The relationship between ANOVA and linear regression (optional).
- Combination of effects: two-way ANOVA.
- "Are these regression lines different?" Analysis of Covariance (ANCOVA) (optional).
Prerequisites
- Mandatory: Good understanding of basic statistics concepts. If you have attended our Think Statistics with R course, then you are all set.
- Recommended: Basic familiarity with R. Our R as a programming language course provides you with the necessary knowledge.
"Bring Your Own Data"
You can bring your own data to this course and run a one-way ANOVA on it.
The data
Your data set shall contain several groups (3 or more) of observations that were subjected to "different levels of the same treatment", but only one kind of "treatment" is considered. Examples:
- Gross yearly income by profession. The treatment is "profession", the levels could be "scientist", "cab driver", "stockbroker" etc.
- Number of people hospitalized with or because of Covid. The treatment is age group, the levels could be "child", "young adult", "middle-aged", "old".
Because of hardware constraints, please don't bring huge genomic datasets. The maximal number of observations per group should be around 100.
The data file
Prepare a comma-separated-values (CSV) file with UNIX line endings (\n) that consists of columns corresponding to the groups of data. You can do this easily with Excel. The first row shall contain the group labels. Ideally all groups should contain the same number of observations (a "balanced" ANOVA design). Save this file on the laptop that you bring to the course.
Data confidentiality
The training VM is protected by a firewall and other security measures. Your training account together with all data will be deleted immediately after the course.
Practical information
Number of participants: minimum 5, maximum 10.
Length: The course takes one half-day, from 09:00 to 13:00 with two short breaks.